Case study #3
Understanding your app’s benefits against its market
2017-2019 Start.io inc

scroll to learn about this project
This project helps app developers better know their users, and through that data, understand their app’s unique positioning in the market.
The goal was to provide developers with a live dashboard that analyzes their data and helps them understand their users’ dimensions such as age, gender, location, and so on. By comparing these, the dashboard provides the necessary context to understand the products’ place within the wider market.
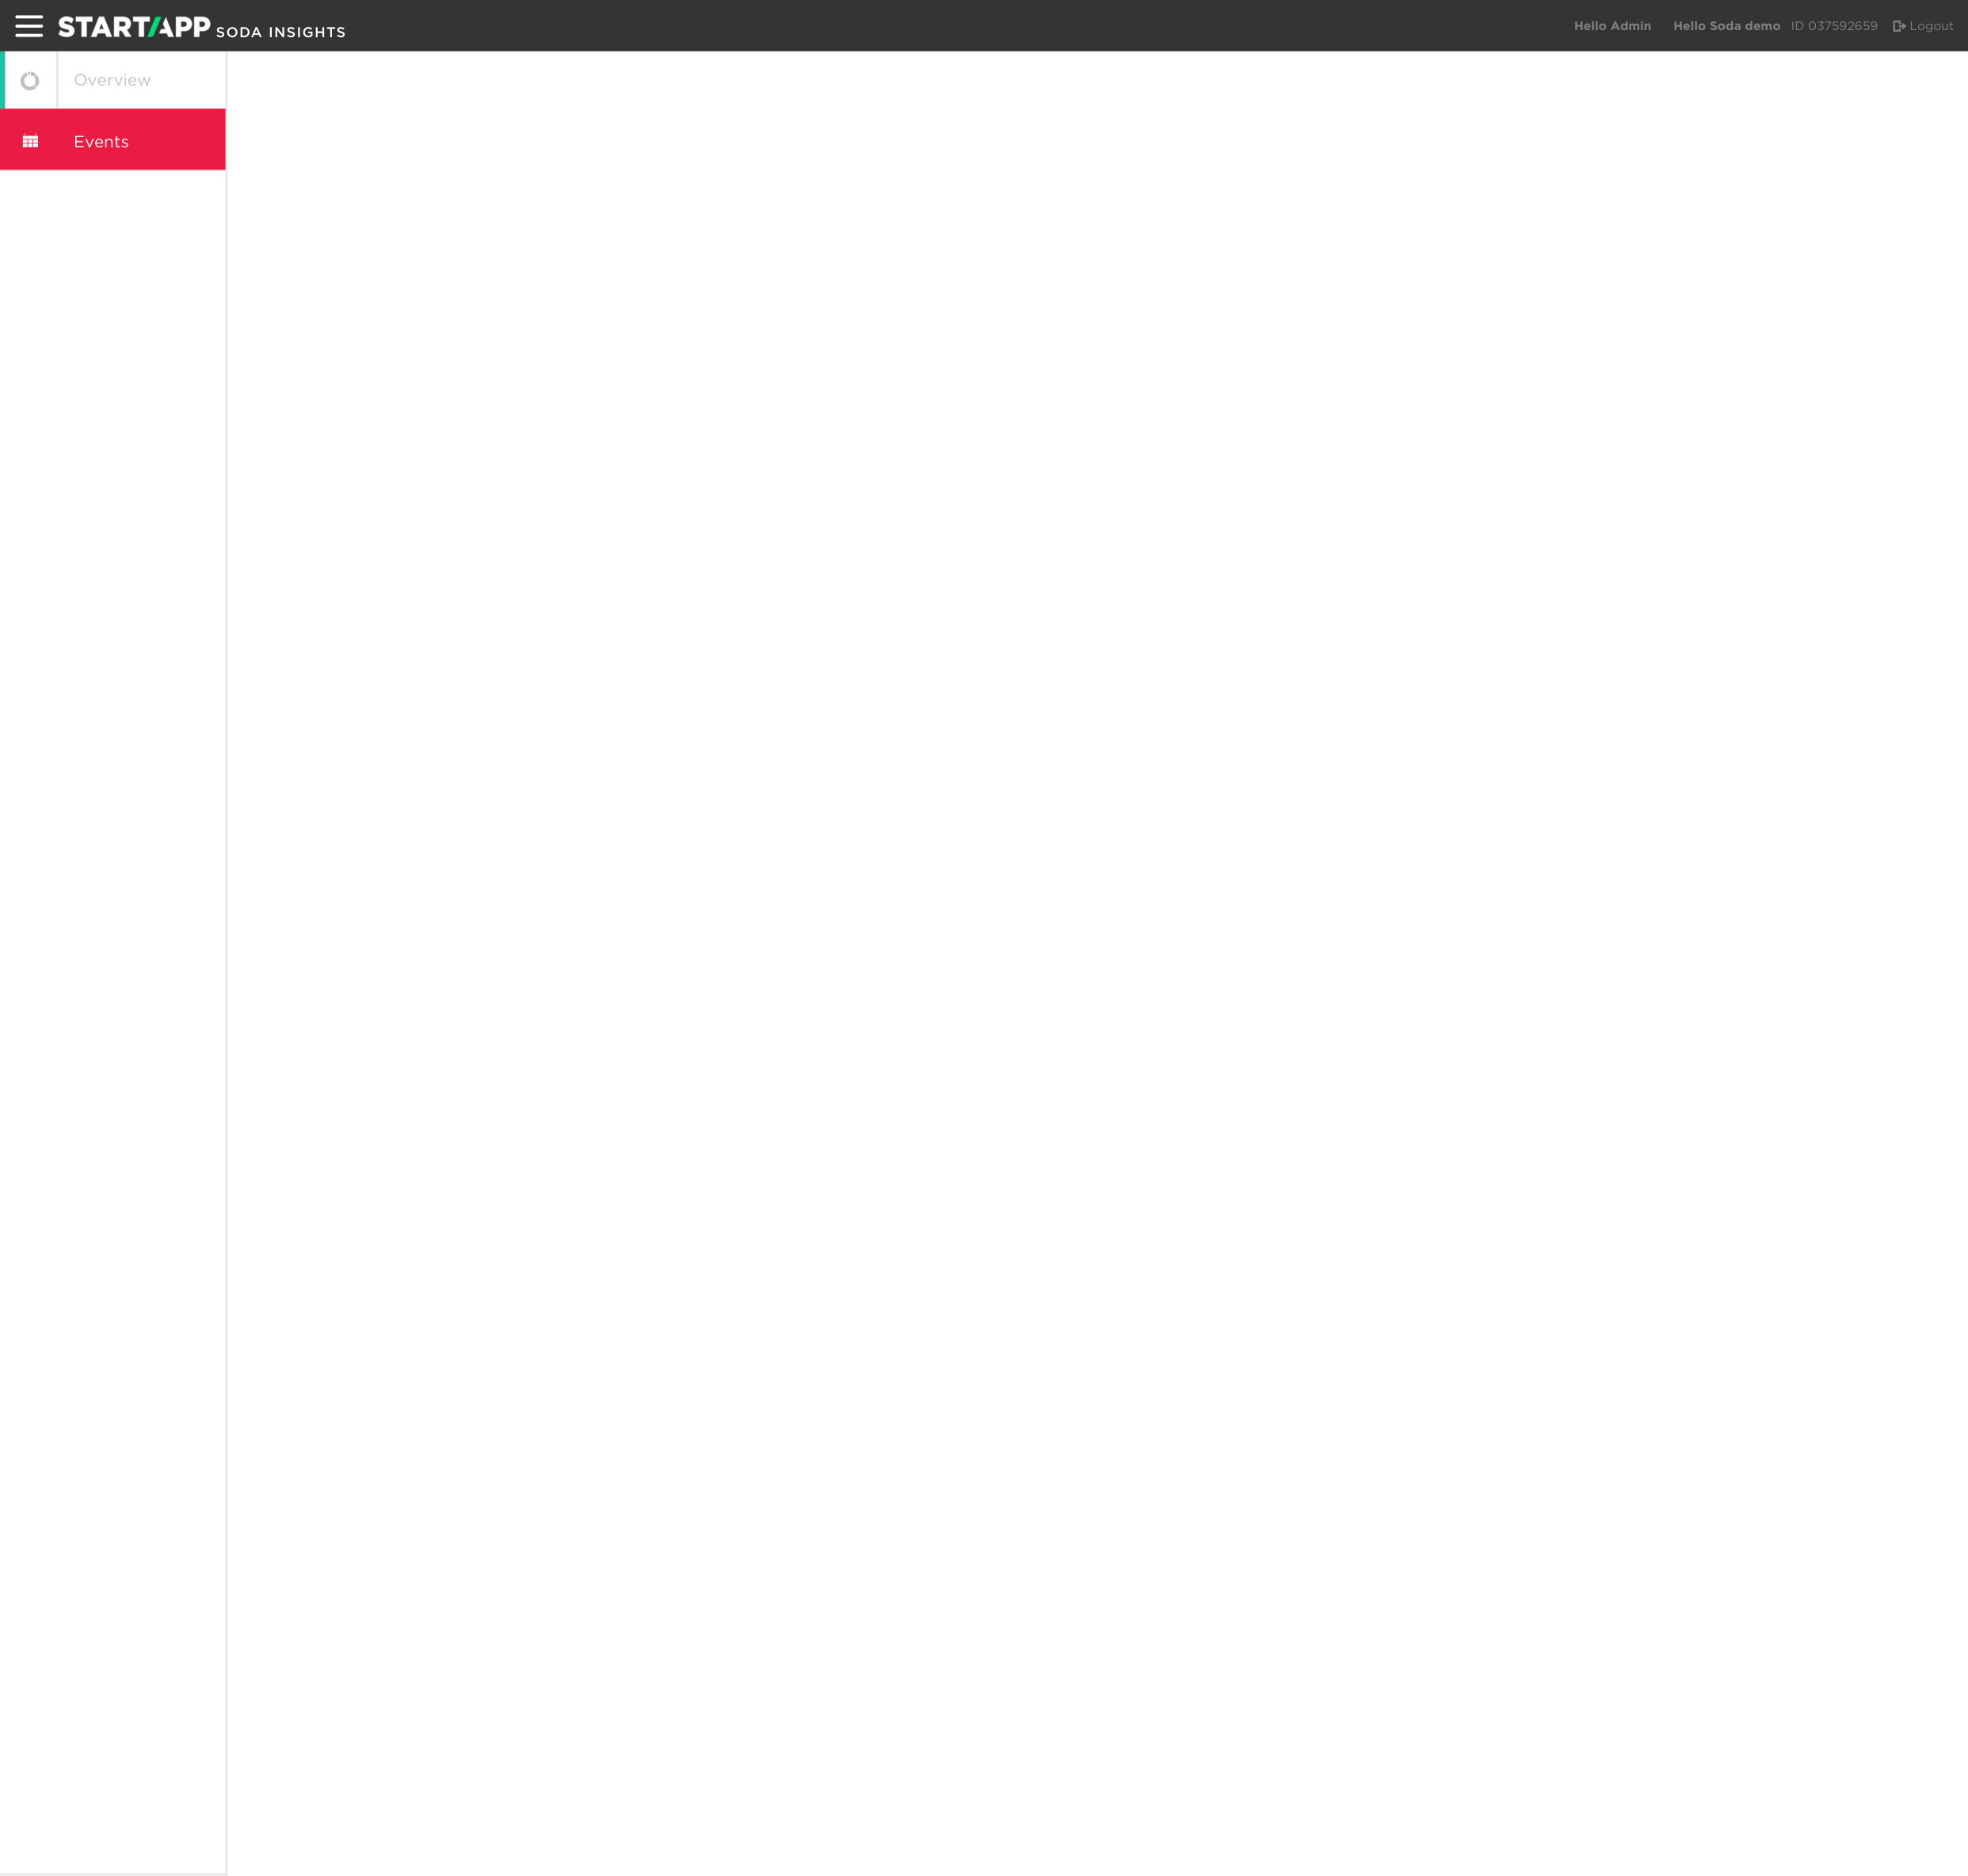
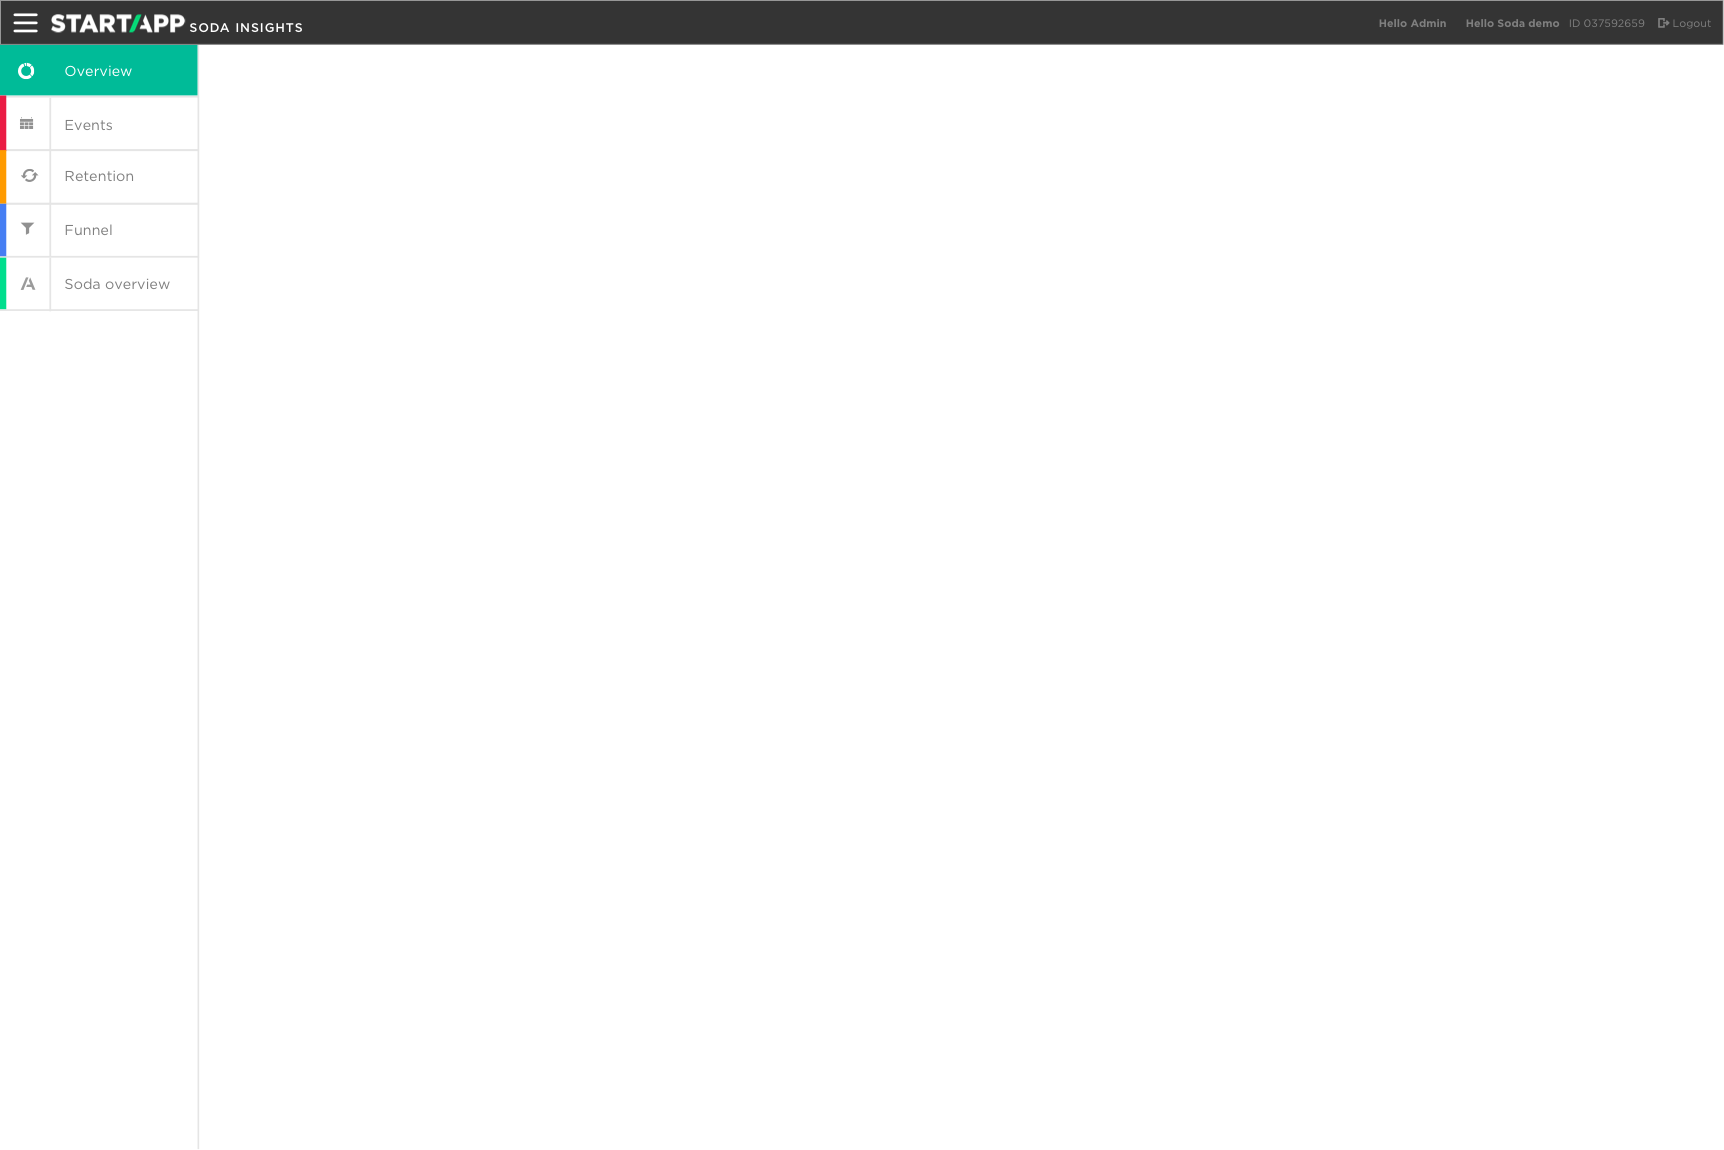
Soda is a data collaboration project for small app owners. Soda partners share their data and in return, receive analytics and insights about their users. The Soda Insights Dashboard was presented to Soda partners right from the sales pitch. It helped the partners understand the revolutionary nature of the Soda platform, and how they could benefit from it. While designing this project, my goal was to present the user with clear and easy-to-read analytics, while putting a spotlight on Soda’s benefits over its competitors.
After much thought and discussion with the product manager and project owner, we realized that our main value was the option for partners to compare themselves to a benchmark of all Soda partners. When it came down to the UX, I decided it was important to show the partner an analysis with a benchmark comparison for every category we presented.
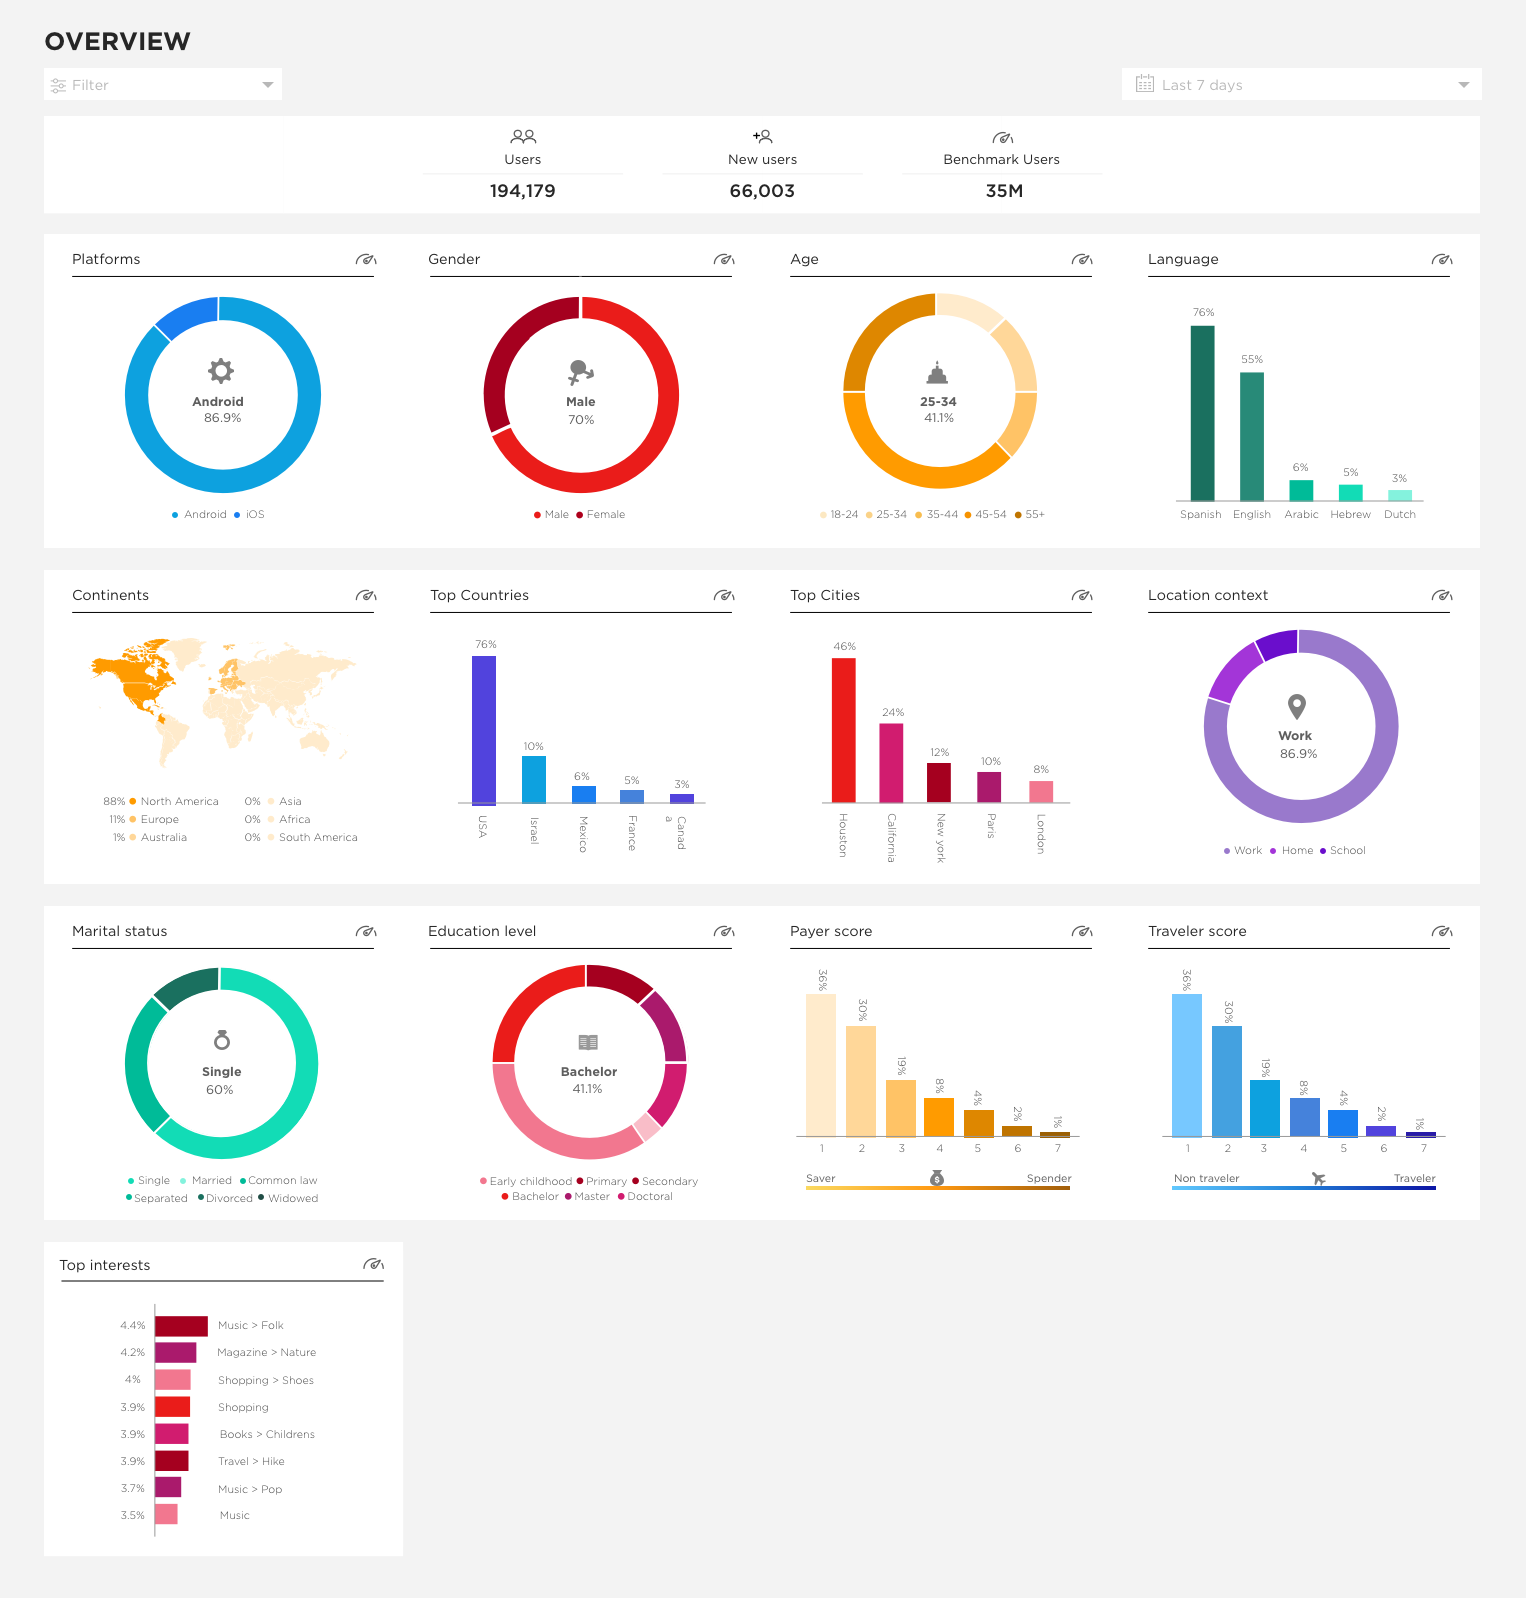
I created a dashboard where every category has a button that can open up a partner for review and compare them to their benchmark. For additional clarification, I added a written analysis that sums up the main insights which came out of the data comparison. Since not all users understand statistical data easily, summing up the information that emerged from the data helped our partners draw conclusions.
The first filter I designed sends each parameter request separately. It was simple and convenient, but did not fit common use. For example, to filter a continent, the user had to go through the menus and select one country at a time. After user testing, there was a requirement to choose several parameters in one request in order to reduce the load on the system.
When I designed the new filter, I chose to open it in a lightbox, which focuses the user process from start to finish. The user sees only the categories, and when they select one, the window expands to show the next step.
This helped in understanding the continuation of the process. The filters are shown using text and graphics (icon/flag), and the choices they select appear on the right, with the option to remove them. When the user finishes, they send only one request to the system.
In order to learn more about each category on the dashboard, I created the drilldown option. Drilldown into a category gives the partner a clear understanding of its behavior, not only by comparison to the benchmark, but in relation to other categories as well. The partner is also able to break down a category.
In order to encourage the partner to use the breakdown feature, I used call to action buttons, presenting all the categories they can break down by both name and icon. When the partner selected a category to break down, the original category was displayed (with the same color from the overview) and next to it, the breakdown category. Partners could easily replace the category using the dropdown menu next to it.
Soda Insights provides its partner with not only a user overview, but also an analysis of their behavior. We started by mapping our partners’ main fields such as: fating apps, messaging apps and social networking apps. I decided to create a dynamic screen, in which each partner would receive the analysis according to their app.
We started by mapping the activity on each type of app. For instance, dating app activity was mostly likes and matches. Messaging app activity was messages between users, conversations and trending topics. Social networking activity was likes, follows, trending searches, trending content, etc.
After understanding the activity, I created various ways to present the data, in order to emphasise user behavior within each activity. For example, dating apps could understand the relationship between the number of likes to matches, or the average time needed to make a match. This helped our partners learn more about their users and understand more about their app benefits over their competitors.
Learning about user behivior
Soda Insights provides its Partner besides the users’ overview, also an analysis of their behavior. We started by mapping our Partners main fields such as: Dating Apps, Messaging Apps and Social Networks Apps. I decided to create a dynamic screen whereby each Partner will get the analysis according to its APP. we started by mapping the events obtained from each type of APP, for instance the Dating APPS events were mostly LIKEs and MATCHes. The Messaging APPS events were Messages between users, Conversations and trending topics. The Social networks events were number of LIKEs, Follow, Trending searches, Trending Content etc. After understandings the events, I created various ways to present the data, in order to emphasize the users behavior of each event. for example, Dating APPS could learn the relation between the number of Likes to Matches or the average time to create a Match. this helped our partners to learn more about their users and understand more about their app benefits over their competitors.